Blog
China’s record trade surplus 2025: Exports pivot beyond U.S. as global trade reshapes in 2026
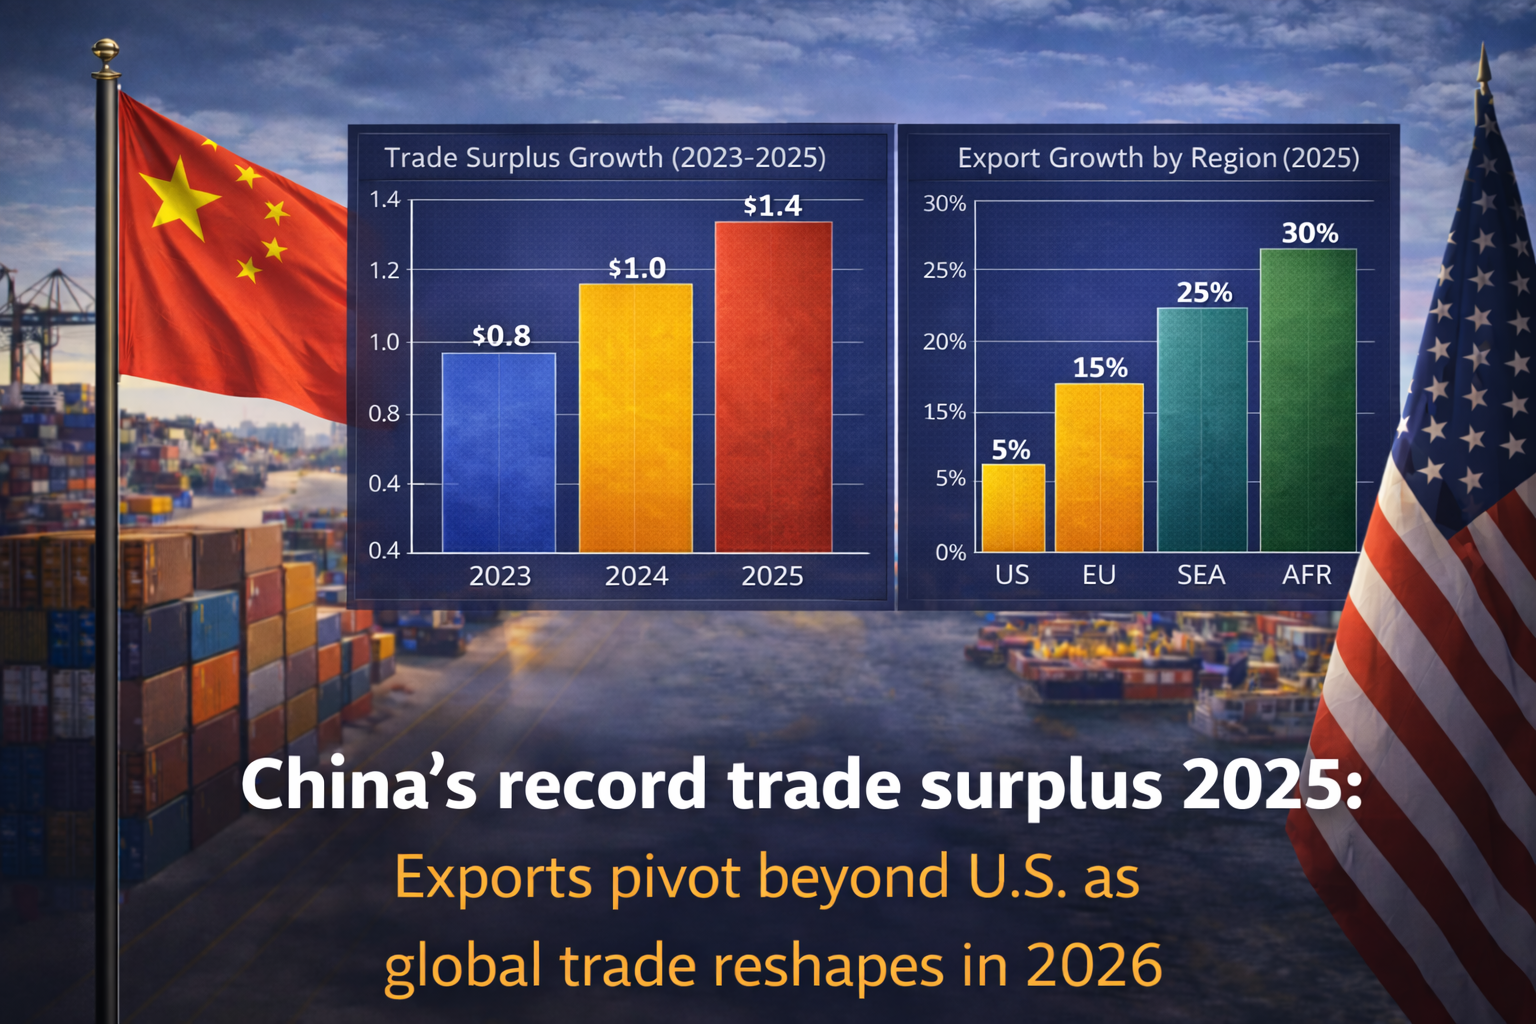
China’s record trade surplus 2025 has emerged as a defining economic story at the start of 2026, as customs data revealed that the world’s second-largest economy posted a historic surplus of nearly $1.19 trillion in 2025 despite ongoing tariff pressures from the United States. Analysts say this milestone reflects both the resilience of Chinese exporters and a broader realignment of global trade flows, with shipments to markets outside the U.S. — including Southeast Asia, Africa, Latin America, and Europe — cushioning the effects of weakening demand in America.
This article provides an in-depth analysis of why China’s trade surplus reached record levels, the markets that drove exports, export sectors that contributed most to the surplus, the implications for global trade in 2026, and how this shift could impact economic partners worldwide.
How China achieved a record trade surplus
In 2025, China’s trade balance — the difference between exports and imports — reached an all-time high of approximately $1.19 trillion, surpassing all previous years and reaffirming China’s dominant position in global commerce. This surplus was driven by a combination of export strength and relatively flat imports.
Key trade figures for 2025
| Indicator | Value |
|---|---|
| Exports (2025) | ~$3.77 trillion |
| Imports (2025) | ~$2.58 trillion |
| Trade surplus | ~$1.19 trillion |
| Export growth (Dec 2025 Y/Y) | +6.6% |
| Import growth (Dec 2025 Y/Y) | +5.7% |
| Exports to U.S. (Y/Y) | -20% |
| Exports to Africa (Y/Y) | +26% |
| Exports to ASEAN (Y/Y) | +13% |
| Exports to EU (Y/Y) | +8.4% |
China recorded monthly trade surpluses exceeding $100 billion in seven months during 2025 — a stark rise compared with only once in the previous year — underscoring strong external demand even amid global economic uncertainties.
Graph: China’s trade surplus growth 2023–2025
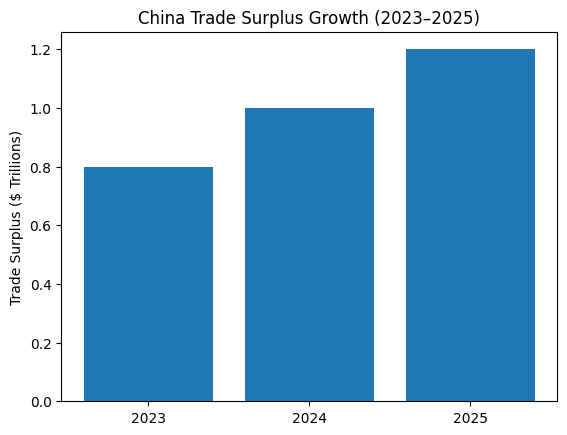
This simple trend chart highlights the steep climb in China’s trade surplus over the past three years.
Export diversification beyond the United States
One of the most striking aspects of China’s export performance in 2025 is how its manufacturers moved away from dependence on the U.S. market — where demand shrank sharply due to heightened tariffs imposed under the Trump administration — and instead strengthened ties with other regions.
Export destination trends (2025)
| Region | Change in Exports (Y/Y) |
|---|---|
| United States | -20% |
| Africa | +25.8% |
| ASEAN (Southeast Asia) | +13.4% |
| European Union | +8.4% |
| Latin America | +7%+ |
Exports to the U.S. fell by approximately 20% in dollar terms, largely due to trade tensions and tariff barriers. However, this was offset by strong demand in other regions. China’s exporters aggressively pursued growth in Africa, Southeast Asia, and Europe — a strategic pivot that played a significant role in sustaining overall export growth.
Sectoral drivers of export strength
China’s export performance was not uniformly distributed across all products. Certain sectors outperformed others and contributed disproportionately to the trade surplus.
Leading export categories (2025)
| Sector | Role in Trade Balance |
|---|---|
| Mechanical & Electrical Products | Largest contributor |
| Computer chips & electronics | Fast-growing |
| Automotive (EVs & hybrids) | +21% shipment growth |
| Rare earths | Record export levels |
| Labor-intensive goods | Declined |
Automotive exports, particularly electric and hybrid vehicles, surged by about 21%, while exports of mechanical and electrical equipment — long staples of China’s industrial base — remained robust. Rare earth exports also hit high marks, even as Beijing began to manage some segments strategically amid global political tensions.
Why China’s trade surplus matters globally
China’s unprecedented trade surplus carries implications far beyond its borders. Analysts and policymakers in developed and developing economies alike are paying attention to how China’s export machine continues to outperform many competitors.
1. Global supply chain leadership
With a surplus comparable to the GDP of some mid-sized nations, China continues to influence global supply chains in sectors ranging from electronics to machinery. Its ability to maintain high export volumes even when facing tariff barriers suggests deep competitiveness and structural advantages.
2. Pressure on domestic manufacturers in trading partners
Export strength can exert pressure on manufacturing sectors abroad, especially in nations with similar export profiles. Countries in Europe and Southeast Asia have expressed concern about competitive pressures arising from high-value, low-cost Chinese products.
3. Trade tensions with major partners
China’s surplus has become a point of geopolitical discussion, with some officials in the U.S. and EU attributing trade imbalances to barriers against imported high-tech goods and structural trade policies. This dynamic shapes the ongoing debate over tariffs, industrial subsidies, and market access.
Domestic context: weak internal demand and export reliance
Despite extraordinary export performance, China’s domestic demand remains relatively weak. Sectors such as real estate and household consumption have underperformed, prompting policymakers to rely heavily on external demand to sustain growth.
Economists warn that prolonged dependence on exports — particularly in lower-value and highly competitive sectors — may expose China to future risks if global demand slows or trade friction intensifies. Strengthening domestic consumption and services may be crucial for balanced long-term growth.
Comparing export growth across regions
Graph: Export growth by destination (2025)

This chart reflects how China shifted its export focus from the U.S. to rapidly growing markets in Africa, Southeast Asia, and Europe.
What to expect in global trade in 2026
Looking ahead, several trends are likely to shape the global trade landscape in 2026:
Continued diversification
China’s ability to find new buyers beyond the U.S. is likely to persist, as markets in Africa, Latin America, and Asia continue to expand. This shift mirrors similar diversification strategies adopted by exporters in other major economies.
Trade policy responses
Some trading partners may adopt countervailing measures to protect local manufacturers from import competition. Trade talks with the U.S. and EU may intensify, focusing on market access, tariffs, and regulatory alignment.
Internal policy recalibration
China may need to accelerate reforms to stimulate domestic demand while managing its surplus carefully to avoid global tensions over perceived export dumping or trade imbalances.
Table: China’s export destination share vs domestic consumption reliance
| Metric | 2024 | 2025 |
|---|---|---|
| Exports (% of GDP) | ~18% | ~18.5% |
| U.S. export share | ~14.7% | ~11.1% |
| Domestic consumption share | 39.9% | ~40% (est) |
While exports continue to account for a significant share of China’s GDP, the relative importance of sales to the United States has declined, indicating a shift toward diversified global markets.
Conclusion
China’s record trade surplus 2025 highlights a pivotal moment in global commerce, illustrating how resilience and strategic diversification — combined with competitive manufacturing — allowed China to thrive amid tariff pressures and shifting global demand.
While imbalances and trade tensions persist, the global economy has seen Chinese exports fuel growth in emerging markets and maintain pressure on trading partners in developed regions. As policymakers and businesses adjust to the evolving trade environment in 2026, the lessons from China’s export pivot are likely to influence export strategies worldwide.